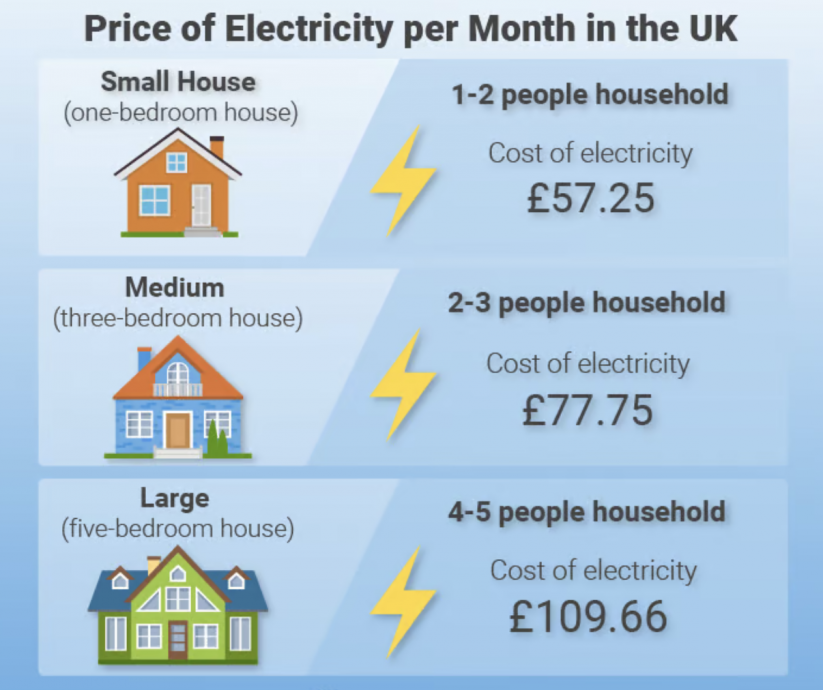
The average UK household energy bill is £1,568/year via direct debit, based on typical usage under the 2024 price cap.
With the recent news of the updated energy price cap, it’s no surprise that people want to be better informed about their energy costs. The current energy price cap stands at £1,568 per year for households that pay via direct debit and £1,522 per year for those using a prepayment meter (effective from 1st July until 30th September 2024).
The average household in the UK, under the current energy price cap (effective from July 1 to September 30, 2024), is expected to pay around £1,568 per year if they pay by direct debit. For households using a prepayment meter, the average cost is £1,522 per year. These amounts reflect typical energy usage and include both electricity and gas. The price per kilowatt-hour (kWh) for electricity is 22.36p, and for gas, it's 5.48p. However, if you use more energy than the average household, your total bill could be higher.
But, what if we looked a bit further?
The energy price cap is not a cap on the total figure you pay, but rather on the unit cost per kWh. The £1,568 cap only applies to households with typical energy usage.
This means you will pay 22.36p/kWh for electricity and 5.48p/kWh for gas, inclusive of VAT, from 1st July 2024 until 30th September 2024.
The actual cost of electricity per kWh is 22.36p, which forms the basis of the Energy Price Cap (EPC) at £1,568 per year for a typical household.
At present, the cost of 1 kWh of electricity is 22.36p per kWh.
Gas prices have also increased, but they remain at 5.48p/kWh for the current period. You can use this figure to calculate your gas consumption costs.
Many people assume electricity prices are the same across the UK, but they vary by region. Below is a table showing the average electricity costs based on location (excluding VAT). If you'd like to include VAT, multiply the numbers by 1.05.
| Area | Avg var unit price in 2021 (p/kWh incl VAT) | Avg var unit price in 2022 (p/kWh incl VAT) | April to June 2023 (excl VAT) | July to Sept 2023 (excl VAT) | Oct to Dec 2023 (excl VAT) | Jan to March 2024 (excl VAT) |
|---|---|---|---|---|---|---|
| Yorkshire | 18.2 | 29 | 30.8 | 27.9 | 25.3 | 26.5 |
| East Midlands | 18.4 | 29 | 30.9 | 28.1 | 25.5 | 26.7 |
| London | 18.9 | 31 | 33 | 29.7 | 27.1 | 28.3 |
The UK, like many countries, has been impacted by the global energy crisis, which has driven up prices. A major cause is the reduction in Russian gas and oil supplies, leading to increased demand from other sources.
The UK government has launched its Energy Security Strategy, aiming to reduce reliance on imports and increase domestic energy production.
The decision to fix your energy bills depends on various factors. With fluctuating prices, some households may benefit from fixed tariffs, while others may prefer to remain on the standard tariff protected by the energy price cap.
To make an informed decision, see our complete guide on whether you should fix your energy prices.
Payment type can also affect your energy bill. Those on prepayment meters typically pay the most, followed by those paying by credit. Direct debit remains the most cost-effective payment method.
</
| Area | Avg unit price (p/kWh) - Credit | Avg fixed cost (£/year) - Credit | Avg unit price (p/kWh) - Direct debit | Avg fixed cost (£/year) - Direct debit | Avg unit price (p/kWh) - Prepayment | Avg fixed cost (£/year) - Prepayment |
|---|---|---|---|---|---|---|
| East Midlands | 19.6 | £98.4 | 18.0 | £81.2 | 19.0 | £73.4 |
| London | 20.0 | £99.0 | 18.4 | £82.5 | 19.0 | £89.4 |
Use the form to request your callback and we'll come back to you straight away.

Put your contact details into the form along with anything you'd like to share with us about the job.

Our office experts will check the details and call you back with prices and availability.

If it sounds good and you like your trade services hassle-free & fully managed then we're ready to book you in!